


After releasing disappointing Q2 earnings, Roblox (NYSE: RBLX) plummeted by as much as 34% reaching new 52-week lows. While the stock has rebounded since by 37%, this rebound may be short-lived as the gaming platform’s Q3 earnings are right around the corner on November 8th pre-market. Analysts are estimating the company to report $829.8 million in bookings while posting an EPS of -$0.495. While the model used in this article forecasts the company to beat the bookings estimate, it projects it to report a wider loss due to the constant growth of its R&D costs. Moreover, the gaming platform is showing signs of struggling to monetize its daily average users (DAU) due to its declining bookings per DAU, a trend the model expects to persist in Q3. With the stock seemingly trading at a premium compared to other players in the gaming industry, taking a short position in RBLX stock may be lucrative ahead of its earnings.
RBLX Stock News
Q3 Forecast
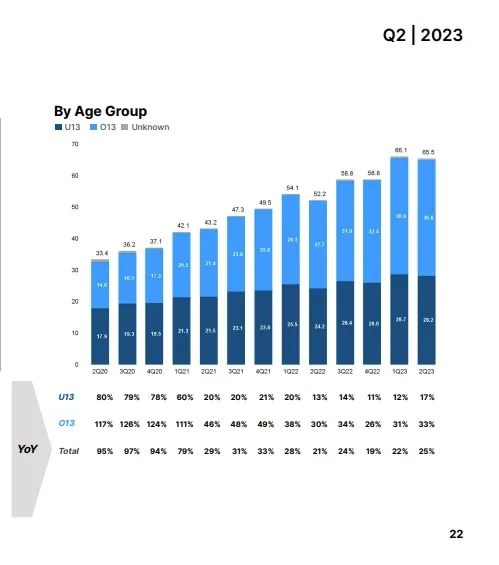
In order to forecast RBLX’s revenue, we have to forecast its DAUs first. With that in mind, the company’s DAUs have historically increased in the year’s second half compared to the first half. As such, we can forecast its Q3 DAU to be more than 72.1 million based on the average QoQ growth rate of 10.17% from Q2 to Q3 in 2020, 2021, and 2022.
| Quarter | DAUs | QoQ Growth |
| Q2 20 | 33,400,000 | |
| Q3 20 | 36,200,000 | 8.38% |
| Q2 21 | 43,200,000 | |
| Q3 21 | 47,300,000 | 9.49% |
| Q2 22 | 52,200,000 | |
| Q3 22 | 58,800,000 | 12.64% |
| Q2 23 | 65,500,000 | |
| Q3 23 | 72,163,021 | 10.17% |
After forecasting Roblox’s Q3 DAUs, we can now calculate its revenue per user to find its revenue projection. Since Q1 2021, the company’s revenue per DAU has been ranging between $9 – $11. Therefore, we can use the average revenue per user over that period of $10.22 to reach a revenue projection of $737.3 million.
| Quarter | DAU | Revenue | Revenue/DAU |
| Q1 21 | 42,100,000 | $386,976,000 | $9.19 |
| Q2 21 | 43,200,000 | $454,100,000 | $10.51 |
| Q3 21 | 47,300,000 | $509,336,000 | $10.77 |
| Q4 21 | 49,500,000 | $568,769,000 | $11.49 |
| Q1 22 | 54,100,000 | $537,134,000 | $9.93 |
| Q2 22 | 52,200,000 | $591,207,000 | $11.33 |
| Q3 22 | 58,800,000 | $517,707,000 | $8.80 |
| Q4 22 | 58,800,000 | $579,004,000 | $9.85 |
| Q1 23 | 66,100,000 | $655,344,000 | $9.91 |
| Q2 23 | 65,500,000 | $680,766,000 | $10.39 |
| Q3 23 | 72,163,021 | $737,329,905 | $10.22 |
Using the same method we can also project Roblox’s bookings in Q3 which is the metric the company mainly focuses on. After pandemic restrictions started to be lifted in 2022, Roblox’s bookings per DAU declined substantially as life returned to normal – declining from $15.56 in Q4 2021 to $11.67 in Q1 2022. Since then, bookings per DAU have roamed around $12 except in Q4 2022 where the gaming platform reported record bookings.
Based on this, we can use the average bookings per DAU since Q1 2022 except Q4 2022 since it is an outlier. In this way, the company’s bookings per DAU can be estimated to be $11.9 which amounts to bookings of $858.5 million, more than analysts’ estimate of $829.85 million by 3.4%.
| Quarter | DAU | Bookings | Bookings/DAU |
| Q1 22 | 54,100,000 | $631,200,000 | $11.67 |
| Q2 22 | 52,200,000 | $639,900,000 | $12.26 |
| Q3 22 | 58,800,000 | $701,700,000 | $11.93 |
| Q4 22 | 58,800,000 | $899,400,000 | $15.30 |
| Q1 23 | 66,100,000 | $773,800,000 | $11.71 |
| Q2 23 | 65,500,000 | $780,700,000 | $11.92 |
| Q3 23 | 72,163,021 | $858,525,857 | $11.90 |
However, an alarming sign could be bookings per DAU stagnating YoY as this shows that the company is unable to monetize its DAU base. As a result, its revenues could stagnate even with DAUs increasing.
A reason behind this could be management’s attempts to add more DAUs from higher age groups. However, that comes at the expense of younger DAUs which make up most of the gaming platform’s DAUs.
Through this projected bookings per DAU metric, we can forecast Roblox’s operating costs based on their percentage of bookings. But first, we’ll forecast the company’s cost of revenue and developer exchange fees.
Roblox’s gross margin averaged 74.51% from Q1 2020 until Q4 2022.
| Quarter | Revenue | CoR | Gross Margin |
| Q1 20 | $161,570,000 | $41,793,000 | 74.13% |
| Q2 20 | $200,392,000 | $53,669,000 | 73.22% |
| Q3 20 | $251,914,000 | $65,818,000 | 73.87% |
| Q4 20 | $310,009,000 | $78,618,000 | 74.64% |
| Q1 21 | $386,976,000 | $97,937,000 | 74.69% |
| Q2 21 | $454,100,000 | $116,930,000 | 74.25% |
| Q3 21 | $509,336,000 | $130,015,000 | 74.47% |
| Q4 21 | $568,769,000 | $151,988,000 | 73.28% |
| Q1 22 | $537,134,000 | $135,632,000 | 74.75% |
| Q2 22 | $591,207,000 | $143,157,000 | 75.79% |
| Q3 22 | $517,707,000 | $126,437,000 | 75.58% |
| Q4 22 | $579,004,000 | $142,432,000 | 75.40% |
After that, its gross margin improved to an average of 76.51% in Q1 and Q2 2023 due to more bookings being processed through credit cards and prepaid cards which has a positive impact on its margins, per management in the Q1 earnings release. Therefore, we can forecast its gross margin in Q3 to be near that 76.51% figure. In this way, a projection for Roblox’s Q3 cost of revenue could be $173.1 million.
| Quarter | Revenue | CoR | Gross Margin |
| Q1 23 | $655,344,000 | $151,841,000 | 76.83% |
| Q2 23 | $680,766,000 | $162,029,000 | 76.20% |
| Q3 23 | $737,329,905 | $173,164,312 | 76.51% |
As for DEF, the company expected this expense to amount to $800 million in 2023 in the Q2 earnings call, and so far, it has incurred $348.2 million in the first half of the year, which means that it expects to incur $451.7 million for the rest of the year. With that in mind, Roblox has historically seen its DEF increase in Q3 and Q4, with the bulk of any given year’s total reported in Q4. Over the last 3 years, the company reported 31.15% of its total DEF in Q4. As such, we can project its DEF to be $202.5 million in Q3 and $249.2 million in Q4 based on management’s forecast.
| Quarter | Dev Ex Fees | % of Total |
| Q1 20 | $44,499,000 | 13.54% |
| Q2 20 | $85,052,000 | 25.87% |
| Q3 20 | $85,475,000 | 26.00% |
| Q4 20 | $113,714,000 | 34.59% |
| 2020 Total | $328,740,000 | 100.00% |
| Q1 21 | $118,938,000 | 22.09% |
| Q2 21 | $129,714,000 | 24.10% |
| Q3 21 | $129,952,000 | 24.14% |
| Q4 21 | $159,717,000 | 29.67% |
| 2021 Total | $538,321,000 | 100.00% |
| Q1 22 | $147,122,000 | 23.58% |
| Q2 22 | $143,148,000 | 22.95% |
| Q3 22 | $151,470,000 | 24.28% |
| Q4 22 | $182,115,000 | 29.19% |
| 2022 Total | $623,855,000 | 100.00% |
| Q1 23 | $182,440,000 | 22.81% |
| Q2 23 | $165,843,000 | 20.73% |
| Q3 23 | $202,511,096 | 25.31% |
| Q4 23 | $249,205,904 | 31.15% |
| 2023 Total | $800,000,000 | 100.00% |
With cost of revenue and DEF out of the way, we can now forecast the rest of Roblox’s operating costs based on their percentage of bookings. First, infrastructure and trust & safety expenses have ranged between 22% – 28% of bookings since Q1 2022. In this way, we can calculate an average of 25.42% of bookings which results in an IST projection of $218.2 million, representing a 14.26% increase YoY. This is in line with management’s expectations in the Q2 earnings call of bookings growth outpacing IST in Q3 since bookings, according to the model, would increase 22.35% YoY.
| Quarter | ITS | % of Bookings |
| Q1 22 | $141,355,000 | 22.39% |
| Q2 22 | $158,235,000 | 24.73% |
| Q3 22 | $190,986,000 | 27.22% |
| Q4 22 | $198,505,000 | 22.07% |
| Q1 23 | $211,044,000 | 27.27% |
| Q2 23 | $225,039,000 | 28.83% |
| Q3 23 | $218,223,202 | 25.42% |
Looking at Roblox’s G&A and marketing costs, we can find that they represent 11.27% and 3.62% on average of bookings since Q1 2020. That said, the average for G&A doesn’t take into account Q2, Q3, and Q4 2020 since the pandemic impacted them due to work from home policy which has led to lower costs. Based on these projected figures, we can forecast G&A cost to be $96.7 million in Q3, while marketing costs can be projected to be $31.1 million.
| Quarter | G&A | % of Bookings | Marketing | % of Bookings |
| Q1 20 | $30,558,000 | 12.24% | $15,657,000 | 6.27% |
| Q2 20 | $18,707,000 | 3.79% | $13,908,000 | 2.81% |
| Q3 20 | $16,168,000 | 3.26% | $12,858,000 | 2.59% |
| Q4 20 | $31,908,000 | 4.97% | $15,961,000 | 2.48% |
| Q1 21 | $94,375,000 | 14.47% | $20,002,000 | 3.07% |
| Q2 21 | $97,678,000 | 14.68% | $18,990,000 | 2.85% |
| Q3 21 | $51,584,000 | 8.09% | $19,599,000 | 3.07% |
| Q4 21 | $59,383,000 | 7.71% | $27,772,000 | 3.61% |
| Q1 22 | $57,772,000 | 9.15% | $29,102,000 | 4.61% |
| Q2 22 | $78,676,000 | 12.30% | $26,501,000 | 4.14% |
| Q3 22 | $81,165,000 | 11.57% | $32,105,000 | 4.58% |
| Q4 22 | $79,704,000 | 8.86% | $29,740,000 | 3.31% |
| Q1 23 | $97,574,000 | 12.61% | $26,755,000 | 3.46% |
| Q2 23 | $96,197,000 | 12.32% | $30,328,000 | 3.88% |
| Q3 23 | $96,775,599 | 11.27% | $31,113,688 | 3.62% |
As for R&D cost, it has been growing sequentially since Q3 2020. The company expects it to continue increasing this year due to increased headcount to develop new features and improve its overall product, according to its Q2 earnings report. That being said, Roblox plans to slow its headcount rate in 2024 through the end of 2025.
Based on this, we can estimate the R&D cost to amount to $367.7 million based on an average sequential growth rate of 16.62% since Q1 2020, representing 42.83% of the projected bookings.
| Quarter | R&D | QoQ Growth | % of Bookings |
| Q1 20 | $49,409,000 | 19.80% | |
| Q2 20 | $40,249,000 | -18.54% | 8.14% |
| Q3 20 | $51,708,000 | 28.47% | 10.41% |
| Q4 20 | $60,067,000 | 16.17% | 9.35% |
| Q1 21 | $96,644,000 | 60.89% | 14.82% |
| Q2 21 | $124,748,000 | 29.08% | 18.75% |
| Q3 21 | $138,245,000 | 10.82% | 21.68% |
| Q4 21 | $173,570,000 | 25.55% | 22.54% |
| Q1 22 | $177,762,000 | 2.42% | 28.16% |
| Q2 22 | $211,757,000 | 19.12% | 33.09% |
| Q3 22 | $235,551,000 | 11.24% | 33.57% |
| Q4 22 | $248,407,000 | 5.46% | 27.62% |
| Q1 23 | $275,537,000 | 10.92% | 35.61% |
| Q2 23 | $315,319,000 | 14.44% | 40.39% |
| Q3 23 | $367,719,031 | 16.62% | 42.83% |
Based on the projections above, Roblox is projected to report an operating loss of $352.1 million.
| Revenue | $737,329,905 |
| CoR | $173,164,312 |
| DEF | $202,511,096 |
| ITS | $218,223,202 |
| R&D | $367,719,031 |
| G&A | $96,775,599 |
| Marketing | $31,113,688 |
| Operating Loss | -$352,177,023 |
For interest income, we can the average amount of Q1 and Q2 2023 since the company turned most of its cash balance into short and long-term investments. As such, we can estimate interest income to be $32.9 million in Q3. As for interest expense, it has averaged around $10 million per quarter since Q1 2022, which we can use for the Q3 projection. This leaves other income which can be projected to be $484.5 thousand based on the average amount since Q1 2022.
| Quarter | Interest Income | Interest Expense | Other Income |
| Q1 22 | $245,000 | $9,999,000 | -$379,000 |
| Q2 22 | $4,197,000 | $9,891,000 | -$3,051,000 |
| Q3 22 | $12,764,000 | $10,005,000 | -$4,302,000 |
| Q4 22 | $21,636,000 | $10,008,000 | $1,988,000 |
| Q1 23 | $31,082,000 | $10,012,000 | -$440,000 |
| Q2 23 | $34,764,000 | $10,129,000 | $3,277,000 |
| Q3 23 | $32,923,000 | $10,007,333 | -$484,500 |
Meanwhile, the average income tax provision since Q1 2020 is $432 thousand, which is the figure we’re using in the model.
| Quarter | Provision for (Benefit from) Income Tax |
| Q1 20 | $1,000 |
| Q2 20 | $5,000 |
| Q3 20 | $19,000 |
| Q4 20 | ($6,681,000) |
| Q1 21 | $2,000 |
| Q2 21 | $20,000 |
| Q3 21 | ($998,000) |
| Q4 21 | $656,000 |
| Q1 22 | $2,000 |
| Q2 22 | ($278,000) |
| Q3 22 | $352,000 |
| Q4 22 | $3,476,000 |
| Q1 23 | $276,000 |
| Q2 23 | ($1,236,000) |
| Q3 23 | $432,000 |
Based on the projections for Roblox’s Q3 income statement, we can expect the gaming platform to report a net loss of $330.17 million or an EPS of -$0.58, which is wider than analysts’ estimate of -$0.495.
| Revenue | $737,329,905 |
| CoR | $173,164,312 |
| DEF | $202,511,096 |
| ITS | $218,223,202 |
| R&D | $367,719,031 |
| G&A | $96,775,599 |
| Marketing | $31,113,688 |
| Operating Loss | ($352,177,023) |
| Interest Income | $32,923,000 |
| Interest Expense | $10,007,333 |
| Other Income | -$484,500 |
| Loss Before Tax | ($329,745,856) |
| Income Tax | $432,000 |
| Net Loss | ($330,177,856) |
| OS | 566,683,861 |
| EPS | ($0.58) |
Valuation
Since Roblox isn’t profitable, we can use its forward P/S ratio to find a fair value for its shares. Currently, the company is competing with Take-Two Interactive Software, Inc. (NASDAQ: TTWO) and Electronic Arts Inc. (NASDAQ: EA) in the gaming sector. With that in mind, Roblox has the highest forward P/S among its competitors, despite both companies being profitable and generating free cash flow.

Meanwhile, the sector median forward P/S is 1.08, indicating that Roblox is overvalued by 447.2%. However, a better figure benchmark ratio to use could be the average forward P/S of both EA and Take-Two which is 4.49. As such, we can reach a price target of $22.4, implying a 34% downside from current levels.
Upside Risks
Despite Roblox’s bearish fundamentals, there’s a risk to consider. While the platform’s bookings per DAU have been declining YoY, there’s a chance this trend is broken after its launch on PlayStation on October 10th. As is, its debut week on PlayStation was extremely successful as it ranked 3rd in the percentage of PlayStation players that played it at least once, according to Circana’s video game industry analyst Mat Picatella. Moreover, the title reached more than 10 million downloads during its debut week, per Axios’ Stephen Totilo.
Media Sentiment
@MandoTrading is anticipating a reversal in the RBLX stock price.
Despite RBLX’s bearish signals, @warrior_0719 is long on the stock.
Technical Analysis
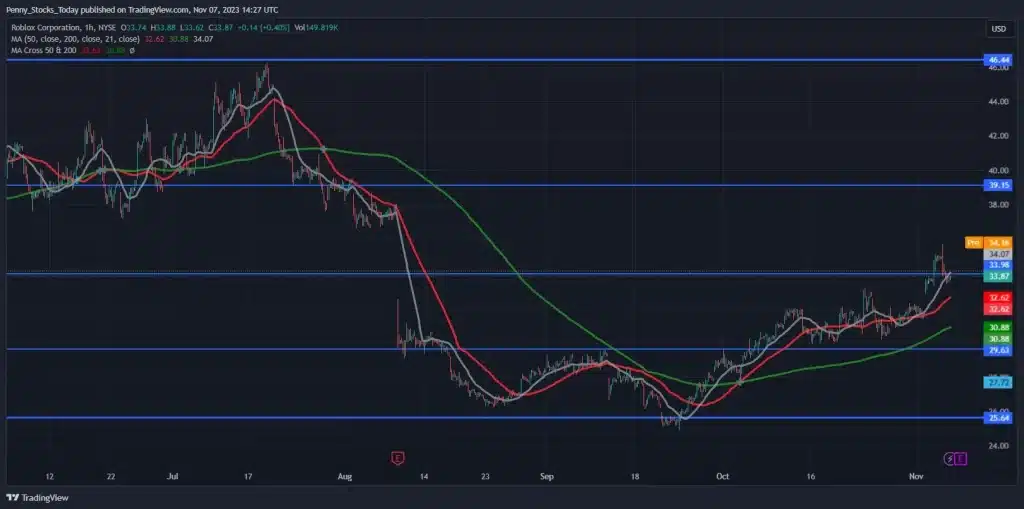
On the hourly chart, RBLX stock is in a neutral trend as it is trading in a sideways channel between $29.6 and $34. Looking at the indicators, the stock is above the 200 and 50 MAs which is a bullish sign. However, it recently failed to break resistance and broke through the 21 MA to the downside. Meanwhile, the RSI is neutral at 54 and the MACD is bearish.
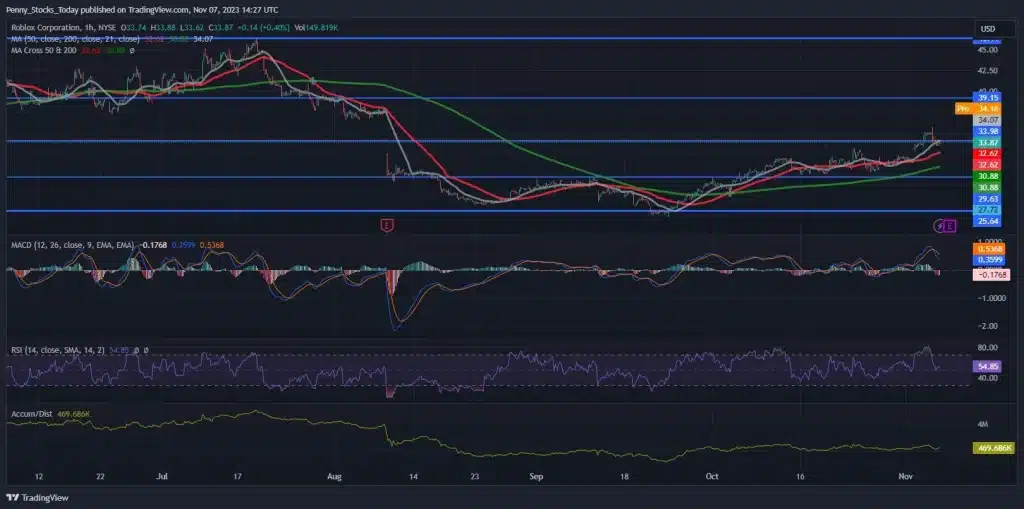
As for the fundamentals, RBLX’s upcoming Q3 earnings on November 8th will be a major catalyst for the stock. Given that the model forecasts the company to post a wider loss than expected along with declining bookings per DAU, its stock may fall and reach a level near the $22.41 price target. Since the stock failed to break resistance, investors could find the price range between $34 and $32 ideal for a short position.
RBLX Stock Forecast
In summary, taking a short position in RBLX stock ahead of its Q3 earnings on November 8th may be a profitable decision as it is expected to post a wider loss than estimates, despite slightly beating analysts’ bookings estimate. Moreover, the model forecasts another decline in bookings per DAU in Q3 which is a sign that the company is struggling to monetize its growing DAUs. Meanwhile, the stock appears to be trading at a premium compared to its peers based on its forward P/S ratio. All of these factors could lead RBLX stock to fall in the near term and reach a level near the $22.41 price target.
If you have questions about RBLX Stock and where it could be heading next feel free to reach out to us in our free alerts room!
Disclaimer
Please visit and read our disclaimer here.